If you are responsible for keeping rotating equipment running, you have likely seen the warning signs: increased vibration, higher operating temperatures, or a gradual loss of efficiency. What you may not see is the microscopic evidence already circulating in your oil. Wear debris analysis is the practice of examining particles suspended in a lubricant to identify the type, severity, and source of wear before a catastrophic failure occurs. In the lab we call this ferrography or particle quantification — on your shop floor, it means knowing whether that gearbox will survive the next shift.
Wear debris analysis is not a single test but a family of techniques, each providing a different piece of the puzzle. The goal is to capture a representative oil sample, isolate the solid contaminants, and classify them by size, shape, composition, and quantity. Done regularly, wear debris analysis gives you a direct window into the health of your machine's internal surfaces.
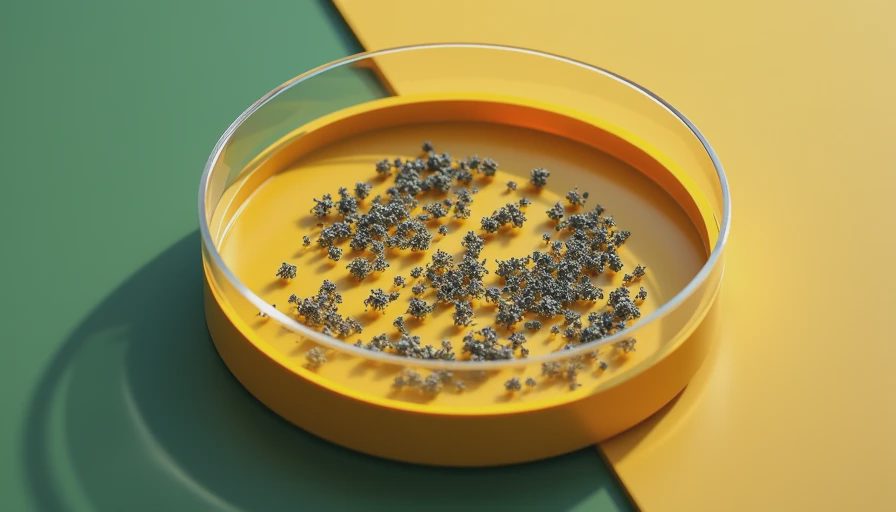
What is Wear Debris Analysis?
At its core, wear debris analysis is the systematic collection and examination of particles that have been generated by the sliding, rolling, or impact of machine components. These particles carry information about the wear mechanism — adhesive, abrasive, fatigue, or corrosive — and the specific component that produced them. By tracking changes in particle concentration and morphology over time, you can detect abnormal wear long before it shows up in vibration trends or oil properties.
The practice is governed by several standards. For example, the American Society for Testing and Materials provides ASTM D7690 for ferrographic analysis and ASTM D7416 for automatic particle counting. The International Organization for Standardization offers ISO 4406 for cleanliness codes and ISO 11500 for automatic particle counting. Adhering to these standards ensures your results are repeatable and comparable across labs.
Key Techniques in Wear Debris Analysis
There are three main approaches to wear debris analysis: direct reading ferrography, analytical ferrography, and automatic particle counting. Direct reading ferrography gives a quick measure of large and small particle concentration — the ratio can indicate the severity of wear. Analytical ferrography uses a microscope slide prepared by magnetic separation, allowing you to view individual particles and classify them by morphology. Automatic particle counting, often used for hydraulic systems, reports particle size distribution in microns.
Each technique has its place. For high-value assets like turbine gearboxes, I recommend analytical ferrography because it provides the richest data. For a hydraulic system that needs frequent monitoring, automatic particle counting with trending is more cost-effective. But no matter the method, the quality of your sample determines the quality of your analysis. Use a sampling valve at a turbulent point in the oil circuit, and always follow the manufacturer's or standard's sampling procedure.
Interpreting Wear Particle Morphology
This is where wear debris analysis becomes an art. Under the microscope, particles tell a story. Spherical particles often come from rolling contact fatigue — tiny balls of metal that have been worn off by micro-pitting. Cutting chips indicate abrasive wear from a hard contaminant like sand or a broken filter. Ribbon-shaped particles suggest adhesive wear, often from scuffing on gear teeth. Platelets are typical of fatigue wear in bearings.
Application Note: If you see a mix of spheres and platelets in a gearbox, that is a strong indicator that the rolling elements are starting to spall. In the lab we call this incipient fatigue — on your shop floor, it means schedule a bearing replacement in the next hundred operating hours. By the relevant standard (ISO 4406 gives you cleanliness, but particle morphology gives you the root cause), you can make that call with confidence.

Setting Up a Wear Debris Analysis Program
Implementing wear debris analysis does not require a huge investment. Start with a list of critical equipment — gearboxes, turbines, compressors, and large hydraulic systems. Determine baseline samples for each machine after an oil change or major overhaul. Then sample at regular intervals based on operating hours or calendar time, typically every three to six months for normal service, but more often for high-load or high-temperature applications.
Use a laboratory that is accredited to ISO 17025. They will provide a consistent test slate and professional interpretation. Many labs now offer online trending portals where you can track particle counts and ferrous density over time. Set alarm limits for your own equipment based on historical data. The cost per sample — typically $75 to $150 depending on the tests — is trivial compared to an unplanned outage.
Common Pitfalls and How to Avoid Them
The biggest mistake is sampling from the wrong location or at the wrong time. Always sample with the system running and at operating temperature. Never sample from the bottom of a sump or after a filter — you want oil that reflects what is circulating through the bearings. Another pitfall is ignoring trend data. A single sample can be misleading, but a series of samples showing increasing particle concentration is a clear red flag.
Also, do not rely solely on automatic particle counters for wear analysis. They do not distinguish between wear particles and external contaminants like dust. Wear debris analysis that includes ferrography gives you the type and morphology, which is essential for diagnosing the root cause. Finally, do not over-sample — an abnormal result from a poor sample leads to wasted time and false alarms.
Cost-Benefit of Regular Wear Debris Analysis
A well-run wear debris analysis program pays for itself quickly. Consider a typical industrial gearbox that costs $50,000 to replace and causes $20,000 per day in lost production. Detecting incipient bearing fatigue a month in advance allows you to schedule a rebuild during planned downtime. The cost of six samples per year, even at $150 each, is $900 — less than 2% of the replacement cost. Companies that implement condition-based maintenance using wear debris analysis report 20–30% reductions in maintenance costs and up to 50% fewer catastrophic failures.
In short, wear debris analysis is not an optional extra for modern maintenance programs. It is a direct, actionable window into your equipment's internal condition. If you already have an oil analysis program, add ferrography to your most critical machines. If you are just starting, begin with a few key assets and build from there. The particles are talking — learn to listen.



No feedback yet — submit the first.