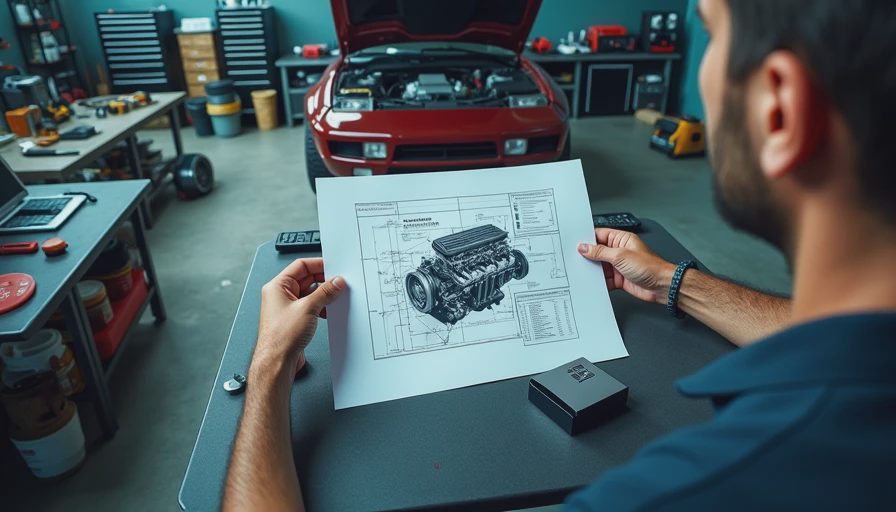
An engine diagram is more than a picture of pistons and valves. For a maintenance engineer, it is a map of load, temperature, contamination risk, and lubricant movement. Read correctly, it helps explain why a bearing runs hot, where an oil restriction can develop, and which seal failure could spread debris through an entire system. Read casually, it can lead to the wrong drain point, the wrong oil grade, or an inspection that misses the actual failure mechanism.
I use an engine diagram before opening a service manual because it establishes the physical relationships that matter. The crankshaft drives the oil pump. The pump sends oil through a filter and galleries. Those galleries feed main bearings, connecting-rod bearings, camshaft journals, valve-train components, piston cooling jets, or turbocharger bearings, depending on the engine design. Every arrow represents a potential pressure loss, heat source, or contamination path.
What an Engine Diagram Should Show
A useful engine diagram identifies the block, cylinder head, crankshaft, camshaft, pistons, connecting rods, oil pump, filter, sump, galleries, and pressure-control valve. A more complete technical drawing also shows coolant passages, breather routes, fuel injection components, turbocharger plumbing, and drain-back paths. These details matter because lubricant performance depends on the surrounding thermal and mechanical environment.
Start at the sump or reservoir and trace the oil in the direction of flow. Locate the pickup screen, pump inlet, pressure-relief valve, filter, and main gallery. Then follow each branch to its load. If the drawing does not show flow arrows, mark them yourself using the pump location and gallery geometry. This simple exercise often reveals that two components assumed to receive equal lubrication are actually at opposite ends of the pressure circuit.
In the lab we call this a pressure gradient. On your shop floor, it means the last bearing in a gallery may receive hotter, aerated, or lower-pressure oil than the first bearing, especially during cold starts or high-speed operation.
Reading Lubrication Paths and Restrictions
An engine diagram becomes especially valuable when investigating oil starvation. Oil starvation means the lubricating film cannot be maintained because the component receives insufficient lubricant or insufficient pressure. The result can be boundary contact, adhesive wear, scoring, and rapid temperature rise. Boundary lubrication describes a condition in which surface-protective additives and molecular films carry much of the load because full fluid separation is not available.
Trace every restriction between the pump and the affected component. A clogged pickup screen, collapsed filter element, narrow gallery, stuck relief valve, or obstructed piston jet can reduce delivery. Do not assume that a normal pump pressure reading proves every component is receiving adequate flow. Pressure is resistance to flow, not flow itself. A partially blocked passage can create acceptable pressure upstream while starving a downstream journal.
For industrial engines and large diesel units, record oil viscosity using the correct classification. ISO 3448 defines industrial viscosity grades, while automotive engine oils are commonly specified by SAE viscosity grades and performance categories. ASTM D445 is used to measure kinematic viscosity. These standards describe different parts of the problem; an ISO VG 46 hydraulic oil is not automatically an appropriate substitute for an engine lubricant simply because its viscosity appears similar.
Application Note: On a standby generator, compare the engine diagram with the actual filter, cooler, and pressure-sender arrangement. A filter installed on a bypass circuit will not protect the same components as a full-flow filter. That distinction changes both sampling strategy and failure interpretation.
Using the Diagram to Investigate Bearing Damage
Main and connecting-rod bearings are not simply smooth supports. They are hydrodynamic bearings, meaning shaft rotation drags oil into a converging clearance and creates a load-carrying film. Film thickness depends on viscosity, speed, load, temperature, and clearance. If any of these move outside the design range, metal-to-metal contact becomes more likely.
Use an engine diagram to identify the direction of crankshaft rotation, oil-hole locations, thrust faces, and gallery entry points. Then compare the damage pattern with the oil path. Wiping near a loaded bearing area can indicate insufficient film strength or excessive clearance. Localized scoring may point toward a particle entering the clearance. A polished thrust face may suggest axial loading rather than a simple viscosity problem.
The Stribeck concept connects these observations: as speed and viscosity increase relative to load, a system generally moves toward thicker fluid-film lubrication; as temperature rises and viscosity falls, the margin narrows. The drawing cannot calculate film thickness by itself, but it tells you where to collect measurements and which operating conditions deserve attention.
Connecting Failure Modes to Components
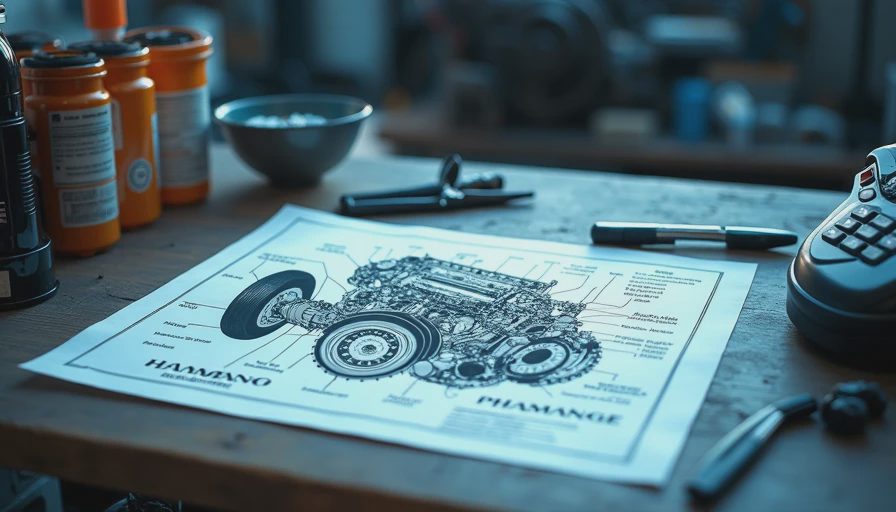
Three failure modes, one root cause is not always the correct diagnosis. A seized camshaft journal, for example, can result from low oil delivery, contaminated oil, excessive clearance, incorrect assembly, or thermal distortion. An engine diagram helps separate these possibilities by showing whether the journal is upstream or downstream of the filter, how it drains, and whether it shares a gallery with damaged bearings.
Look for three physical clues. First, identify where debris would originate. Second, determine how the debris would travel. Third, inspect the components most likely to receive it. Ferrous wear particles from a gear or cam lobe can circulate through the sump and damage soft bearing overlays. Coolant contamination can reduce oil-film strength and promote corrosion. Fuel dilution can lower viscosity and reduce the load-carrying margin, particularly during extended idling or repeated cold starts.
For grease-lubricated auxiliaries, do not force an engine-oil recommendation into the analysis. NLGI consistency grades describe grease stiffness, not complete performance. A bearing may require an NLGI 2 grease with a specified thickener, base oil viscosity, and operating-temperature range. The component drawing and lubrication chart must agree before a product is selected.
Building a Practical Inspection Plan
Turn the engine diagram into a sequence of checks. Begin with the reservoir level and visible contamination. Confirm the filter part number, installation direction, bypass-valve specification, and drain-back arrangement. Measure oil pressure at the manufacturer’s stated test points rather than relying only on a dashboard sender. Record oil temperature because pressure without temperature context can mislead.
Next, sample the lubricant before draining the system. A clean sample can be tested for viscosity, water, fuel dilution, oxidation, and wear metals. ASTM methods are commonly used for several of these measurements, but the laboratory report should identify the method used. Trend results over time instead of treating one result as a complete diagnosis.
Finally, inspect the highest-risk component shown by the engine diagram. Check pickup screens, galleries, relief valves, turbocharger supply lines, and piston cooling jets as appropriate. Photograph sludge, varnish, scoring, and seal debris before cleaning. Those deposits are evidence, not merely dirt.
A Shop-Floor Example
Consider a diesel engine with normal cold oil pressure but low pressure after an hour under load. The engine diagram shows that the turbocharger and camshaft receive oil from a gallery downstream of the main bearings. The first suspicion might be a worn pump, yet a hot-condition pressure loss can also result from increased bearing clearance, oil thinning, or a relief valve that leaks when warm.
A disciplined investigation measures hot viscosity, checks fuel dilution, verifies gauge accuracy, and compares pressure at multiple points. If the main gallery pressure is acceptable but turbocharger supply pressure is low, the restriction lies in that branch. If pressure is low everywhere and bearing clearances are excessive, replacing the pump alone will not restore the design film.
That is the practical value of an engine diagram: it prevents component swapping from replacing diagnosis. Use the drawing to trace flow, connect symptoms to loads, and select measurements that can disprove your first theory. In the lab we call this a system boundary. On your shop floor, it means knowing exactly where the oil has been and where it still needs to go.




No feedback yet — submit the first.