Oil Analysis: The Lab Test That Saves Your Machinery
Oil analysis is not a luxury—it's a discipline that separates reactive maintenance from reliability-centered programs. In the lab we call this condition monitoring; on your shop floor, it means catching a bearing failure before it turns into a shaft replacement. Every maintenance manager I've worked with, from marine diesels in Seattle to paper mills in Idaho, agrees: a $30 oil sample can save $30,000 in downtime.
Why Oil Analysis Matters
The economics are straightforward. A routine oil analysis typically costs between $25 and $50 per sample, depending on the test package. Compare that to an unplanned gearbox rebuild—$5,000 to $15,000 for parts alone, not counting lost production. The return on investment is rarely less than 10:1 when you include avoided downtime.
More important than the cost savings is the failure-prevention logic. In the lab we categorize failure modes into three families: wear debris, fluid degradation, and contamination. Oil analysis addresses all three. By the relevant standard (ISO 4406 for cleanliness, ISO 3724 for filterability), you can quantify each. When a sample shows a spike in iron particles above 50 ppm, you know a gear or bearing is shedding material. When the viscosity drops below the grade tolerance (e.g., ISO VG 320 falling below 288 cSt at 40°C), the film thickness is compromised. When water content exceeds 0.1%, you have an ingress problem.

Application Note: I once consulted for a tugboat operator whose main engine had repeated bearing failures. Their oil analysis showed silicon (dirt) levels around 200 ppm—ten times the acceptable limit. The root cause was a cracked air intake boot. A $200 hose replacement ended $12,000 bearing replacements.
Common Tests and What They Reveal
A standard industrial oil analysis package includes these core tests, each governed by an ASTM or ISO method:
- Viscosity (ASTM D445): The single most important indicator. A 10% change from new oil warrants investigation. In the lab we call this the backbone of film thickness; on your shop floor, it means the oil is either thinning (fuel dilution, shear) or thickening (oxidation, soot).
- ICP Elemental Analysis (ASTM D5185) : Measures wear metals (iron, copper, chromium, lead) and additive metals (zinc, calcium, phosphorus). Trend is everything—a doubling of iron from one sample to the next is more alarming than the absolute number.
- Particle Count (ISO 4406) : Reports the number of particles per milliliter at 4, 6, and 14 microns. A typical target for hydraulic systems is ISO 4406 18/16/13. Anything higher risks valve stiction and pump wear.
- Water Content (ASTM D6304) : Karl Fischer titration gives precise water content. Even 200 ppm can reduce bearing life by 50% in certain grease-lubricated systems.
- Acid Number (ASTM D664) and Base Number (ASTM D2896) : For engine and turbine oils, AN tracks oxidation, BN tracks additive depletion. When AN rises 2 mg KOH/g above the new oil baseline, it's time to change.
These tests don't exist in isolation. A high iron count with a rising AN and falling viscosity points to a specific failure sequence—oxidation thins the oil, metal contact generates wear, and the wear debris accelerates further oxidation. In the lab we call this the death spiral; on your shop floor, it means you're about to lose a gearbox.
Setting Up an Effective Oil Analysis Program
An effective program starts with baseline samples. Take a sample from new oil before it goes into the system—that's your reference. Then sample at regular intervals, typically every 100 to 500 operating hours depending on the criticality of the equipment. Consistency matters more than frequency; a monthly sample on a hydraulic press tells you more than a random sample every six months.
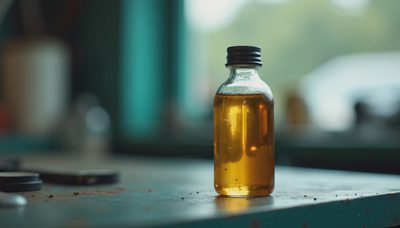
Sampling technique is non-negotiable. Use a clean sample bottle, sample from a live zone (after the pump, before the filter), and avoid adding new oil just before sampling. Contamination from a dirty sampling port has misled more maintenance teams than any analytical error.
ISO 14224 provides a framework for categorizing equipment criticality and setting sampling intervals. For a wind turbine gearbox, you might sample quarterly; for a paper machine dryer section, every month during the high-load season.
Interpretation is the hardest part. Numbers alone don't tell the story—trends do. A single high wear-metal reading could be from a new component breaking in. A steady rise over three samples is a call to action. By the relevant standard (ASTM D7720), you establish control limits based on historical data. Anything outside those limits triggers an investigation.

Application Note: A pulp mill I worked with had a 500-hp hydraulic pump that was squealing under load. Their oil analysis showed particle count of ISO 4406 21/19/17—well into the danger zone. The source was a failed return-line filter. Replacing the filter and flushing the system brought the count down to 18/16/13 and eliminated the noise. That filter cost $150. The pump replacement would have been $8,000.
Interpreting Results: A Practical Example
Let's walk through a real-world case from my consulting files. A marine diesel engine (Caterpillar 3516, 2000 hp) was sampled every 250 hours. At 5,000 hours, the iron jumped from 15 ppm to 45 ppm, copper from 5 ppm to 22 ppm, and lead from 2 ppm to 8 ppm. Viscosity remained steady at 14.5 cSt (grade SAE 40, range 12.5-16.3 at 100°C). Water was 150 ppm.
What these numbers tell us: Iron is from cylinder liners or rings, copper from bearings or coolers, lead from overlay bearings. The viscosity staying in grade ruled out fuel dilution. The water was high but not catastrophic. The diagnosis: the engine was beginning to wear at the ring/liner interface, likely from a mixture of abrasive contamination (silicon was also up to 18 ppm) and boundary lubrication during cold starts.
We recommended increasing the sample frequency to every 100 hours and adding a magnet plug inspection. Three samples later, the wear metals stabilized and then dropped as a new batch of additives from a top-up helped buffer the acidity. Silicon remained high, so we tracked it to a leaky air filter. The engine ran another 8,000 hours without a major overhaul. The oil analysis program cost about $600 over that period. The overhaul it avoided would have been $25,000.
The Bottom Line
Oil analysis is not a standalone tool—it's part of a reliability-centered maintenance strategy that includes vibration analysis, thermography, and visual inspection. But it gives you something no other tool can: direct chemical evidence of what's happening inside your machine. In the lab we call this molecular-level condition monitoring; on your shop floor, it means knowing exactly when to change the oil, when to change the filter, and when to shut down and replace a component before it fails catastrophically.
If you're not sampling yet, start with your most critical equipment. Get a baseline, set a schedule, and commit to the discipline of trending. Your machinery will thank you with longer life and lower cost. And if you're already sampling but not acting on the results, that data is wasted. A lab report sitting in a file cabinet is just paper. A lab report acted upon is the difference between a planned outage and a catastrophic failure.
By the relevant standards—ISO, ASTM, and NLGI—oil analysis is proven. The only question is whether you'll use it.


No feedback yet — submit the first.